P5.JS - Procedural Generation of Terrain
Quick links for the p5js/ecosystem sketch:
The overall intent of this sketch is to explore:
- Procedural Generation of terrain and resources.
- Agent based-behavior of competing and symbiotic relationships.
It uses the P5.JS library, which facilitates drawing to an HTML5 canvas as well as gives us a collection of utility functions that make our lives easier.
This post will mostly cover aspects of the Procedural Generation approach thus far.
Brief intro to Perlin Noise
This version relies heavily on the P5.JS noise() function (see Wikipedia - Perlin Noise for more background).
It produces “smooth” random values over a dimension or space. This is great when it comes time to produce smooth rolling hills and valleys.
What I mean by “smooth” is that, when you pass in values that are close to each other, you get random values that are also close each other.
> noise(10)
0.7980347909289686
> noise(10.0001)
0.798054696949244
> noise(10.0002)
0.7981140027869248
Furthermore, if you pass in an input value between two values that are already close to each other, the output is will also be close each other.
> noise(10.00005)
0.7980397738952753
And P5.JS allows you to do this 1, 2 or 3 dimensions.
Using Perlin Noise to create Elevation
Since we’re looking for a simple top-down map in this version, we’ll use the the 2-dimension option to pass in the X and Y values of each cell to obtain the noise at that point.
Another important aspect of noise() function in P5.JS is that it will always produce values between 0 and 1.
That means if we want to translate that elevation above and below sea-level, we need to:
- Multiple it by some sort of factor
- Translate that
0.0 to 1.0range into values ranging from-500 to 500
In this sketch, this is achieved with the following:
this.elevation = 500 - 1000 * noise(this._row, this._col);Note: This could also be achieved via the function lerp(), but that will be saved for another post.
One challenge of using X and Y pixel values as input is that stepping from 1 pixel to another is a bit big of a jump, and the noise() function
And so we multiple our inputs by a scaling value:
this.elevation = 500 - 1000 *
  (
    noise(this.scale * this._row, this.scale * this._col)
    + (ecosystem.getPercentWater() - 0.5)
  );
Setting the color based on Elevation
We now have an elevation for each pixel, but we want to turn them into colors we’d expect to see on a map so:
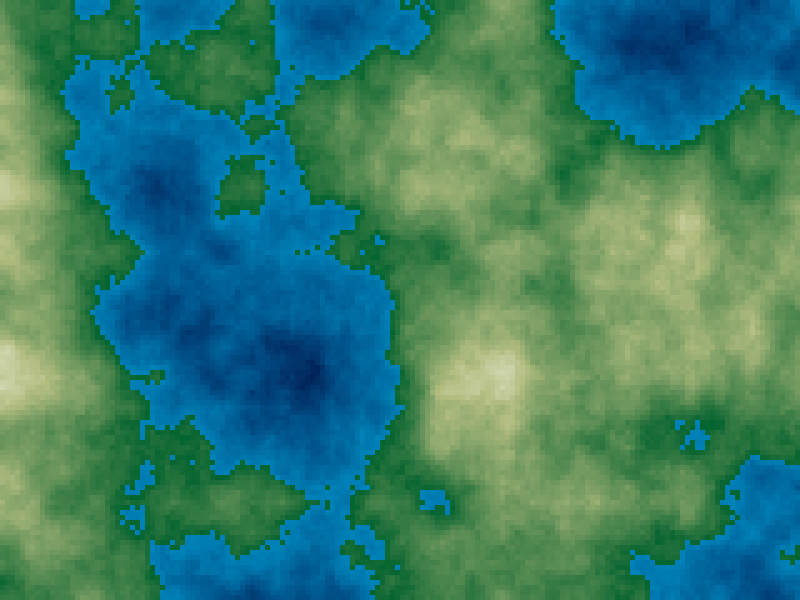
- Blues for water.
- Greens for coast and midlands.
- Browns / Whites for mountains.
We can achieve this using P5.JS lerpColor() function.
The lerpColor() function takes 3 parameters:
- The color to start at.
- The color to end up at.
- A percent value (as values between
0.0 - 1.0)- where 0% means you’re at the starting point, and 100% means you’re at the end point.
It returns a color that can be passed into other drawing functions in P5.JS.
Since we want to have 3 different color transitions, we need to establish 3 different brackets and use different sets of colors.
| Elevation Range  | Starting Color            | Ending Color    |
|------------------|---------------------------|-----------------|
| -300 to 0        | Deep Blue                 | Turquoise Blue  |
| 0 to 300         | Deep Green                | Pale Yellow     |
| 300 to 500       | Pale Yellow               | White           |
Which can roughly translate to code:
if (this.cell.elevation < 0){
  percentToEnd = norm( this.cell.elevation, -300, 0);
  fillColor = lerpColor(this.colorDeepBlue, this.colorTurqoise, percentToEnd);
}else if(this.cell.elevation < 300){
  percentToEnd = norm( this.cell.elevation, 0, 300);
  fillColor = lerpColor(this.colorDeepGreen, this.colorPaleYellow, percentToEnd);
} else{
  percentToEnd = norm( this.cell.elevation, 300, 500);
  fillColor = lerpColor(this.colorPaleYellow, this.colorWhite, percentToEnd);
}
Resulting output